MPEG7 Visual Story
Recently, I came across a few beautiful examples of visual storytelling websites and thought I’d like to try creating something similar myself. At that time, I happened to be working with MPEG-7 Visual Descriptors, so it felt like the perfect opportunity to combine the two ideas.
I also wanted to experiment a bit with D3.js, as I hadn’t really had a chance to use it before. I’d heard about its steep learning curve, but since I was taking a D3.js introduction course at university, I decided to give it a go.
The goal of the project was to explain what certain MPEG-7 descriptors do using visual illustrations. In particular, I covered Dominant Color Descriptor, Scalable Color Descriptor and Color Layout Descriptor.
Originally, I wanted to make all the computations server-side only, but using OpenCV in JavaScript turned out to be quite a headache. In the end, I had to set up a small FastAPI backend to handle the K-Means-based descriptor computation. After wrestling a bit with Python’s OpenCV (why is it BGR and not RGB?? 😅), everything finally started to work as expected.
The page itself could definitely use some more polishing, but it served its purpose — and I’m quite happy with how it turned out!
You can check it out here: mpeg7.diana.lumias.cz.
Below are a few screenshots from the project.
BTW, during this project I also discovered Unsplash Gallery, which is an amazing resource for free, high-quality images.
Dominant color descriptor and Prague metro tiles
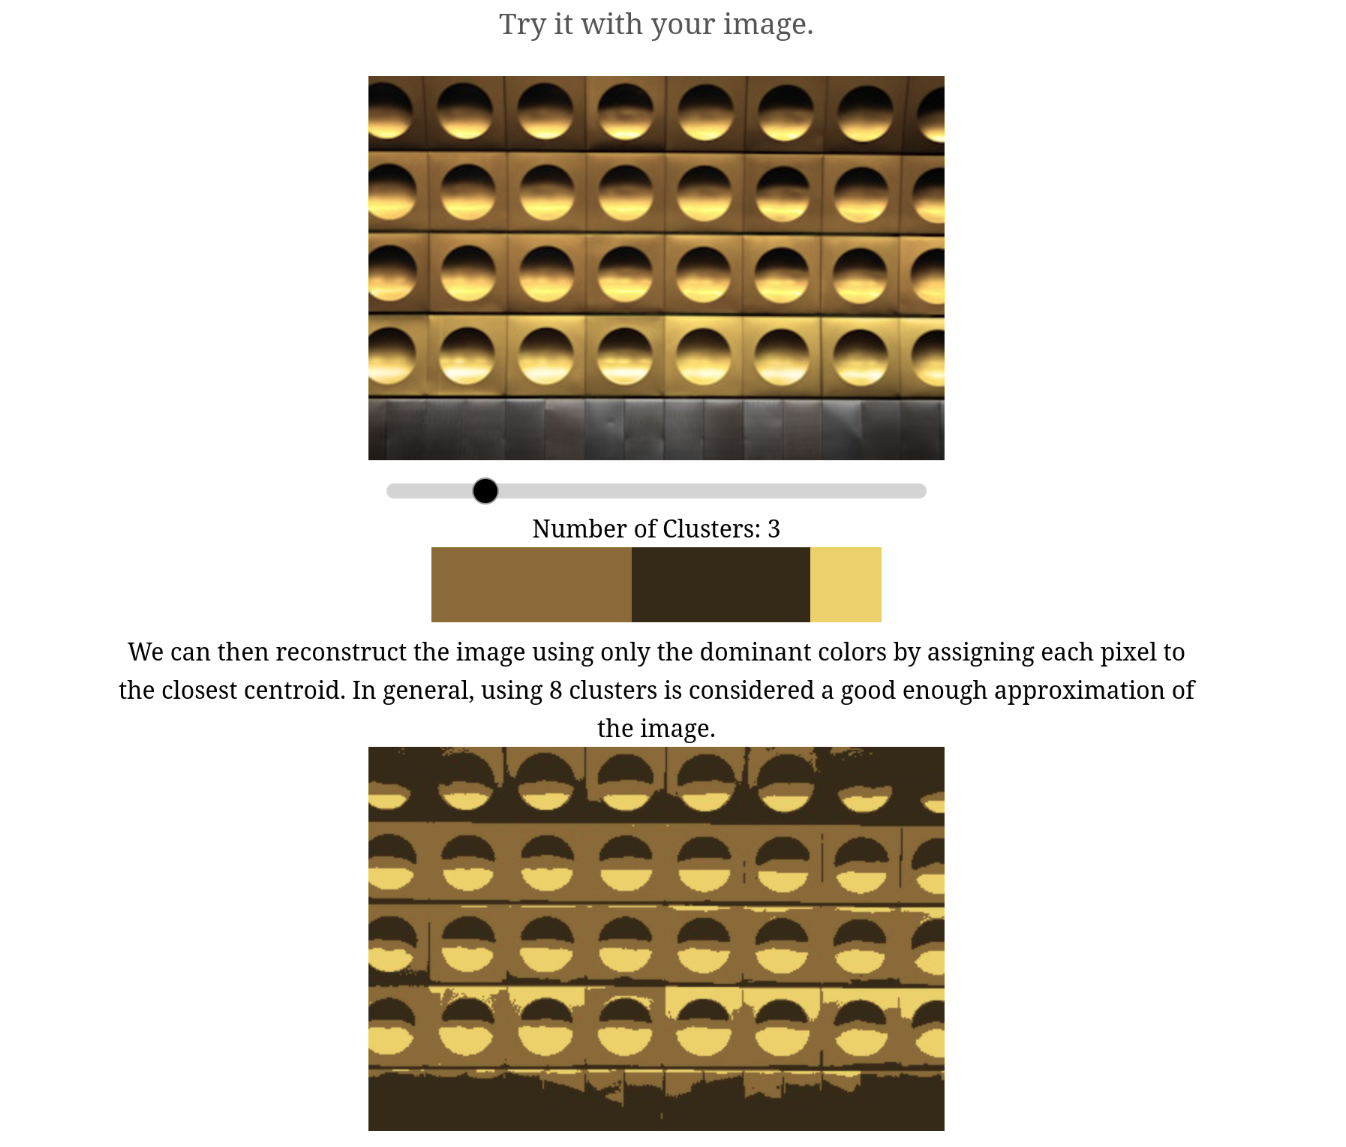 Explanation of the descriptor
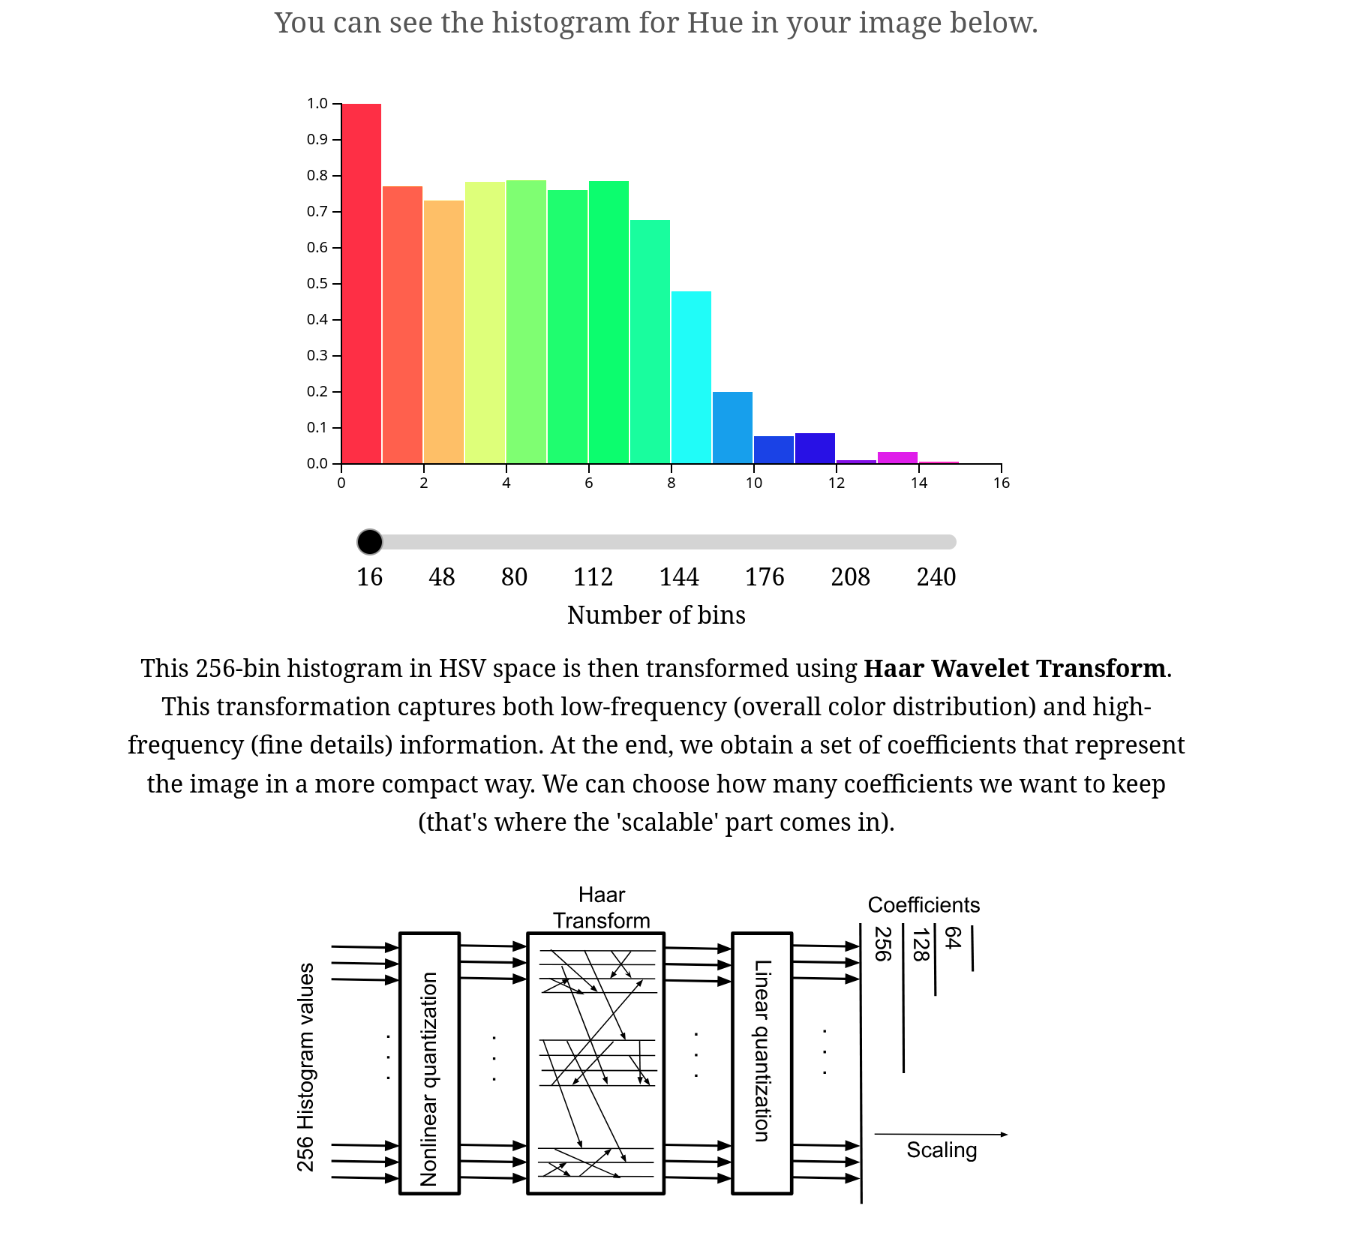
 Scalable color descriptor and Haar transform